VMAF Analysis
Netflix's open-source VMAF score is quickly becoming an important metric in our industry. You can read their Tech Blog entry about how the test was developed. They followed up with a second article as well. In a nutshell, it considers both visual fidelity information as well as data loss and motion to provide a perceptual quality score
Scores range between 0 and 100 where 100 is identical to the compared asset.
Compare Asset
VMAF compares two videos, so we need to specify a compare_asset in our analyze task. A common pattern is to use the VMAF analysis directly following a transcode task and provide the original source as the compare_asset to evaluate the quality of the transcoded output.
Scaling Options
In addition to the compare_asset settings, we also can specify which video should be scaled to match the resolution of the other before comparing. Since in this case, we want to scale the transcoded video back to the resolution of the source, so we set the "size_selector": "compare_asset", since our compare_asset is the source. Additionally, we can specify a scaling algorithm if desired; Netflix recommends bicubic which is the default. We set this explicitly in our example.
Options are:
bilinearbicubicnearest_neighborlanczosbicubic_splinespline16spline36sinc
API Options
Using the options specified in the API Docs, you can enable a few other options:
model- Options for model:
1080p4kphone
- Options for model:
results_file- In addition to the charting data, you can get per-frame VMAF scores in the results file.
Sample Usage
The sample json below shows an example VMAF analysis comparing the output of a transcode task to the original source. In this example we specify the bicubic scaling algorithm where we scale the transcoded output to match the original source. We save the results file to storage, which includes the per-frame VMAF scores.
{
    "uid": "analyze_task",
    "kind": "analyze",
    "payload": {
        "general_properties": {
            "enabled": true
        },
        "compare_asset": {
            "kind": "asset_url",
            "payload": {
                "storage_provider": "s3",
                "url": "{{source_url}}"
            }
        },
        "deep_properties": {
            "video": {
                "settings": {
                    "comparative": {
                        "size_selector": "compare_asset",
                        "scaler": {
                            "algorithm": "bicubic"
                        }
                    }
                },
                "vmaf": {
                    "enabled": true,
                    "model": "4k",
                    "results_file": {
                        "file_pattern": "{source_basename}_VMAF_results_analysis.json",
                        "location": {
                            "storage_provider": "s3",
                            "path": "{{destination_path}}"
                        }
                    }
                }
            }
        }
    }

}
Analyzer Results
Results from running this analysis will be reported in the Hybrik console, as well as in the job summary json, in the "analyzer / deep_properties" section of the job result json.
In the Hybrik console:
- Select the completed job from the list in the upper pane
- In the lower pane click the "Task Details" tab
- Click the "Analyzer Results" box
- Expand the view
Console view
Here are what the results look like in the Hybrik Web Console
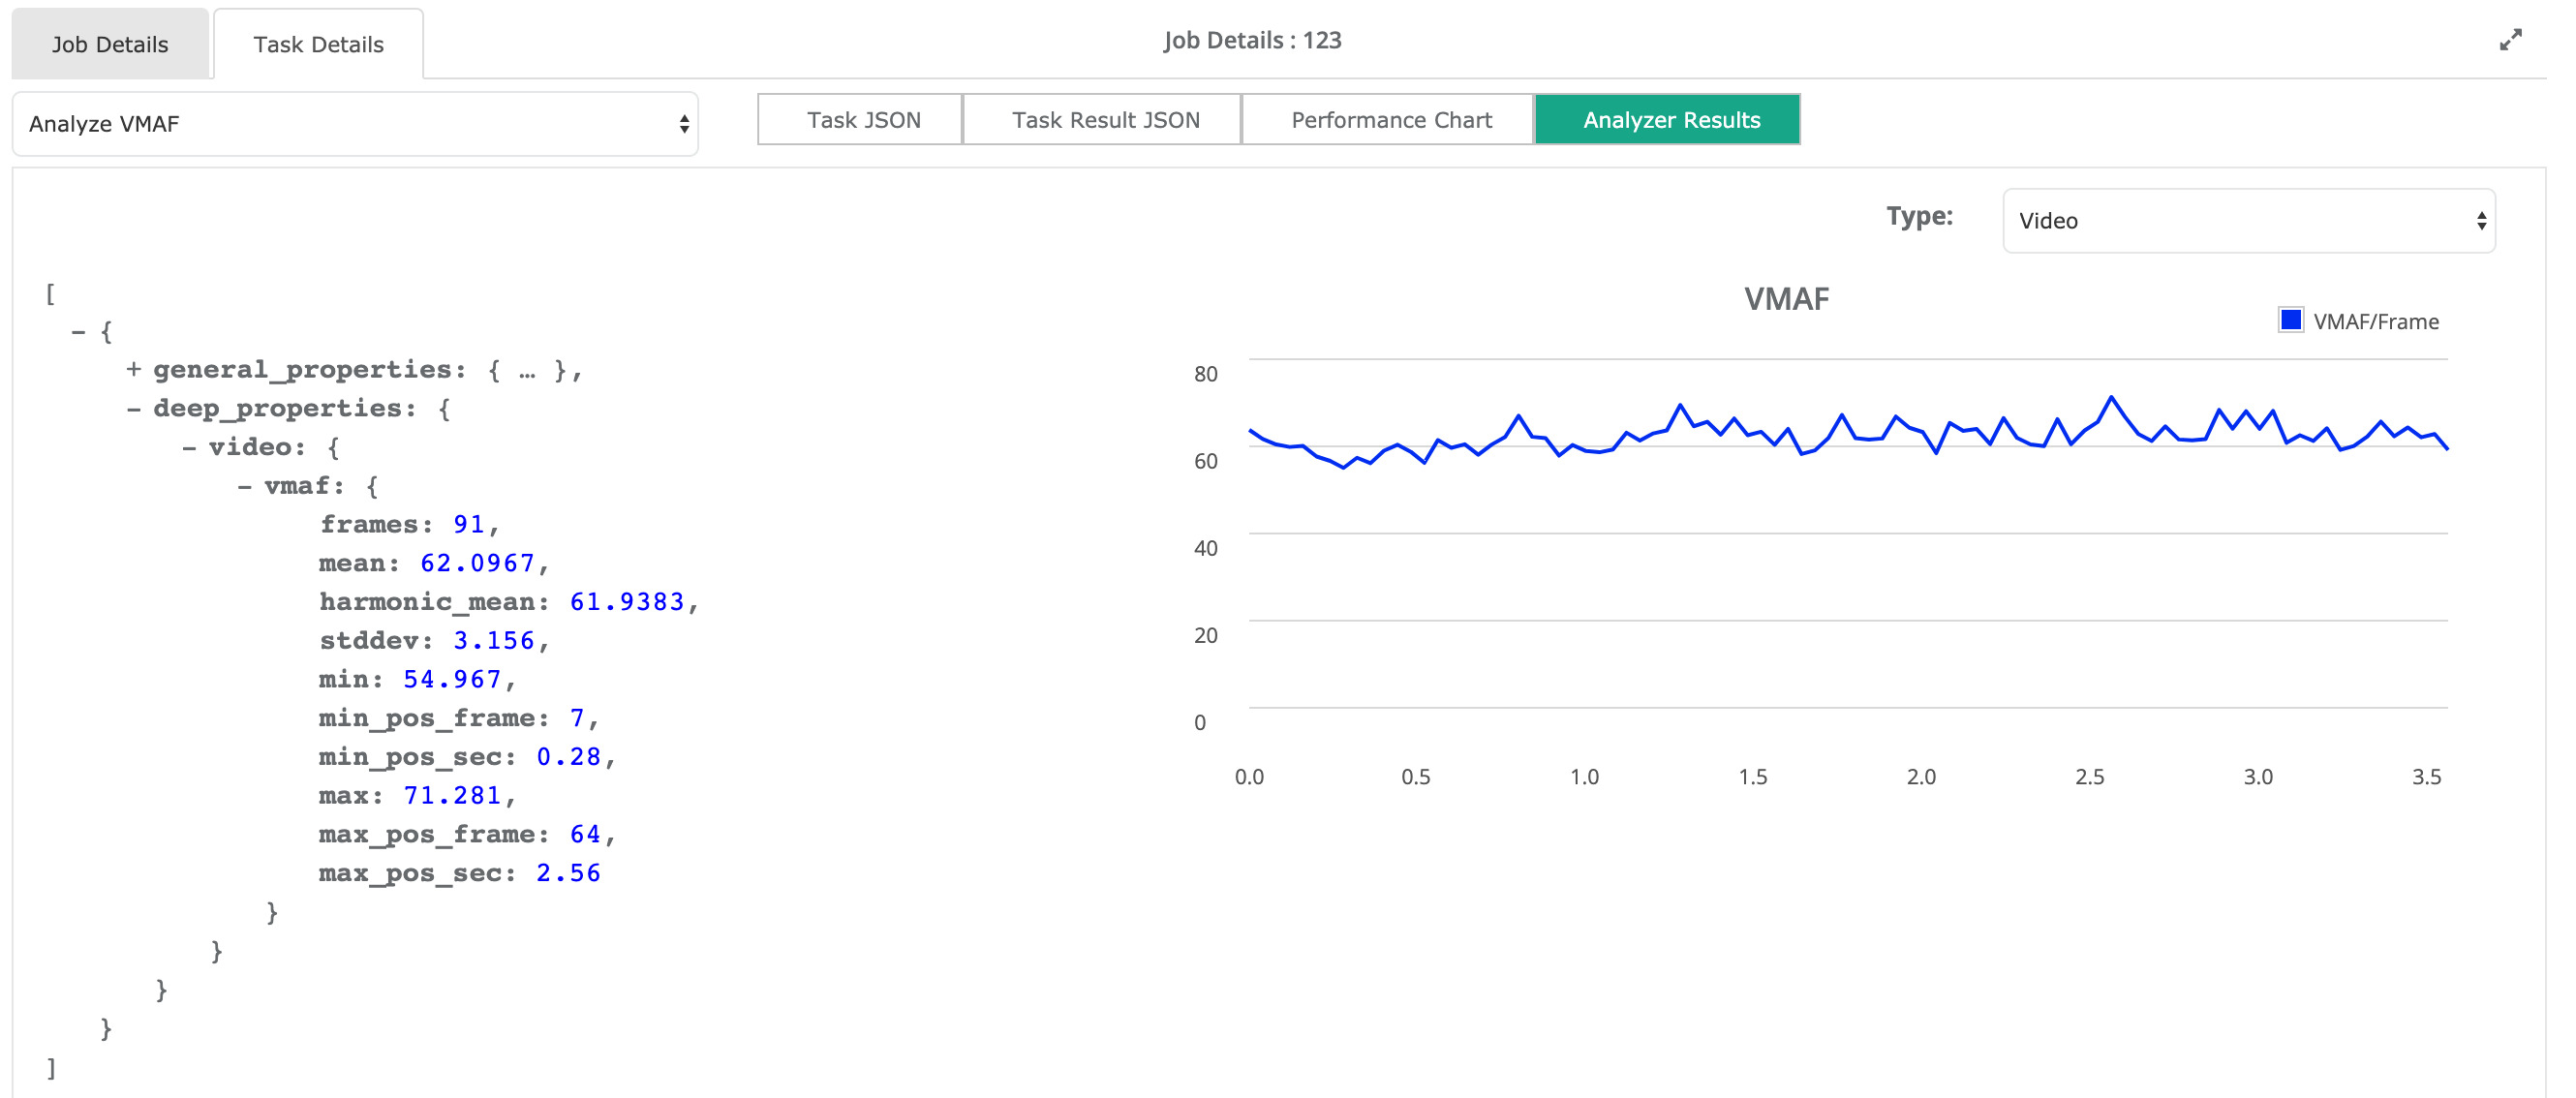
Analysis Result JSON Excerpt
The results for VMAF will show positional information for highest and lowest scores as well as the mean, which is the overall VMAF score for the duration of the file.
"deep_properties": {
  "video": {
    "vmaf": {
        "frames": 91,
        "mean": 62.0967,
        "harmonic_mean": 61.9383,
        "stddev": 3.156,
        "min": 54.967,
        "min_pos_frame": 7,
        "min_pos_sec": 0.28,
        "max": 71.281,
        "max_pos_frame": 64,
        "max_pos_sec": 2.56,
        "charts": [
            ...
Example Job
- VMAF Analysis example job with results file
- Example VMAF Analysis results json
- Example VMAF Analysis results json with per-frame score