Cloud Player
The Hybrik Cloud Player enables you to view files in the web interace that would otherwise be unplayable. For example, there is no way to easily play a 500Mbps ProRes file from the cloud. In order to view or QC such a file, you would need to download it to your local machine and then play it. With the Hybrik Cloud Player, you can play this file without downloading!
The Cloud Player uses a new Dolby technology called RASP (see below) to enable the viewing of many formats that would typically be unviewable including QuickTime, MXF, Dolby Vision, etc.
Note: The Cloud Player has an incremental cost for usage and must be activated in your Hybrik account. Please contact your Dolby representative to activate it.
What is RASP?
RASP stands for Resource Agnostic Swarm Processing. In simple terms, RASP is able to instantly get compute resources from across the public clouds and apply those to transcoding short segments of video and audio. When you hit the "play" button, RASP is just-in-time transcoding the master video and audio into a HLS format that can be displayed in the browser. RASP only creates the parts of the video that you watch. In other words, if you only need to test 10 minutes of your 2 hour master, RASP will only encode those 10 minutes. This makes RASP both high-performance and cost-effective. RASP starts working instantly, so there is no delay waiting for machine instances to become available. RASP can be used for cloud playback, as well as other low-latency processing needs like ad processing and video optimization.
Launching the Cloud Player
There are two ways to launch the Cloud Player: (1) from the Storage Browser and (2) from the Completed Job list. When launching from the Cloud Player, you can select multiple files to be part of your playback. This can include alternate audio and subtitle tracks.
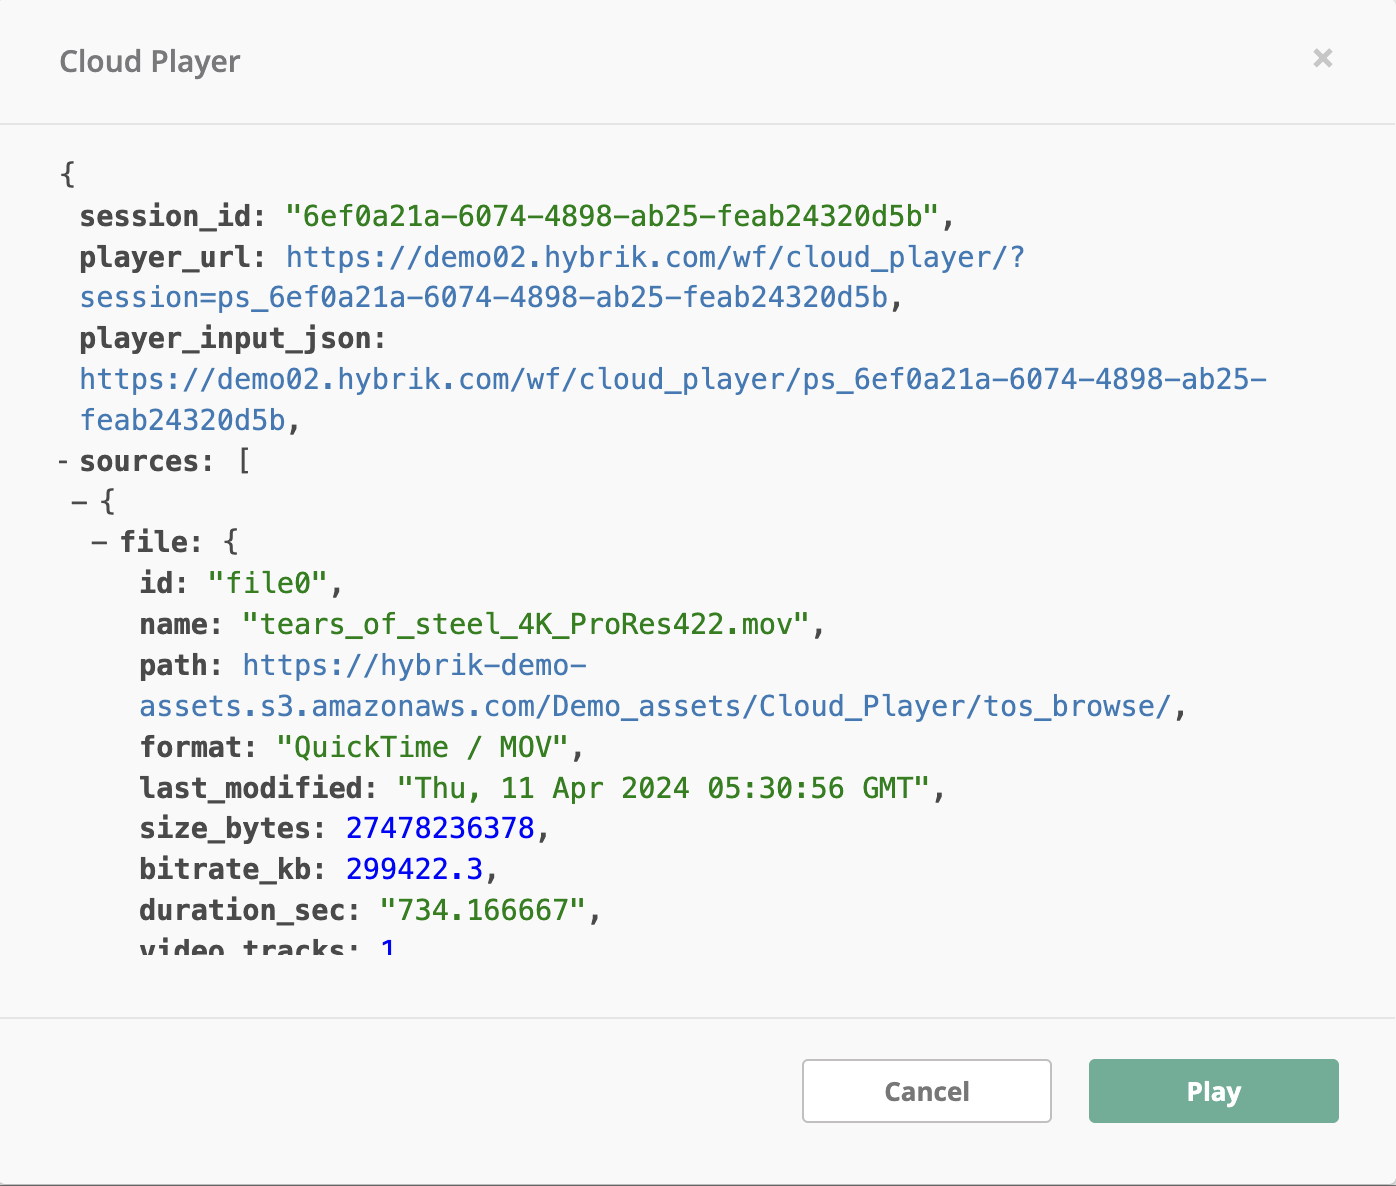
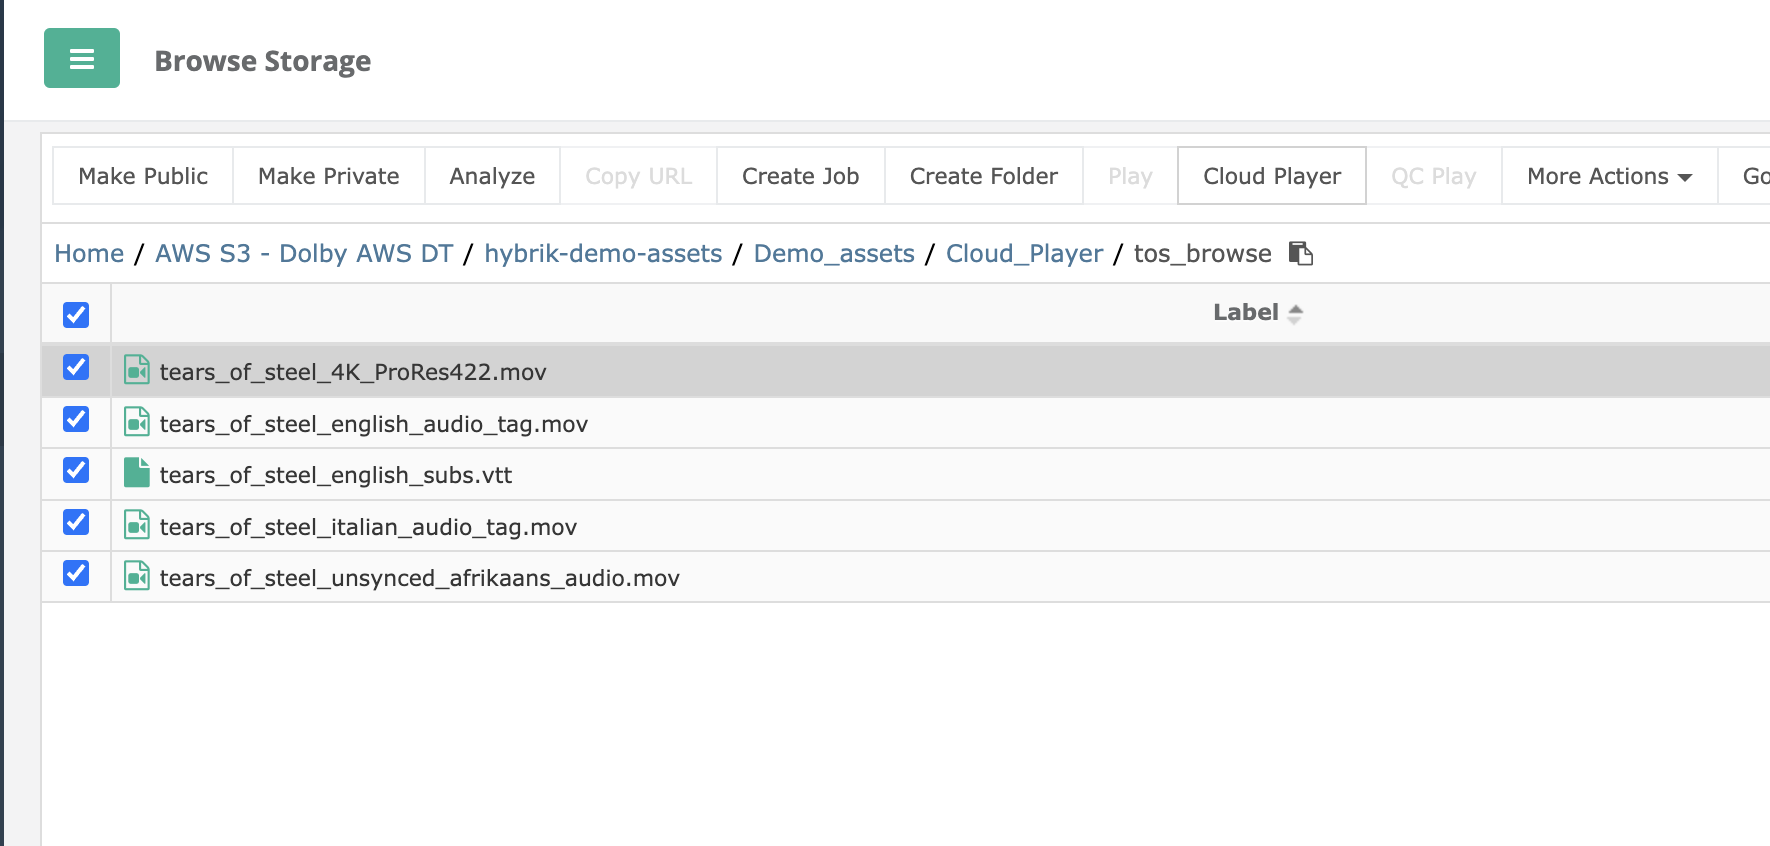 Prior to launching the Player, the Hybrik system will verify that the content is accessible to the RASP engine and playable. The Cloud Player dialog comes up to verify this. Continue by hitting the Play button.
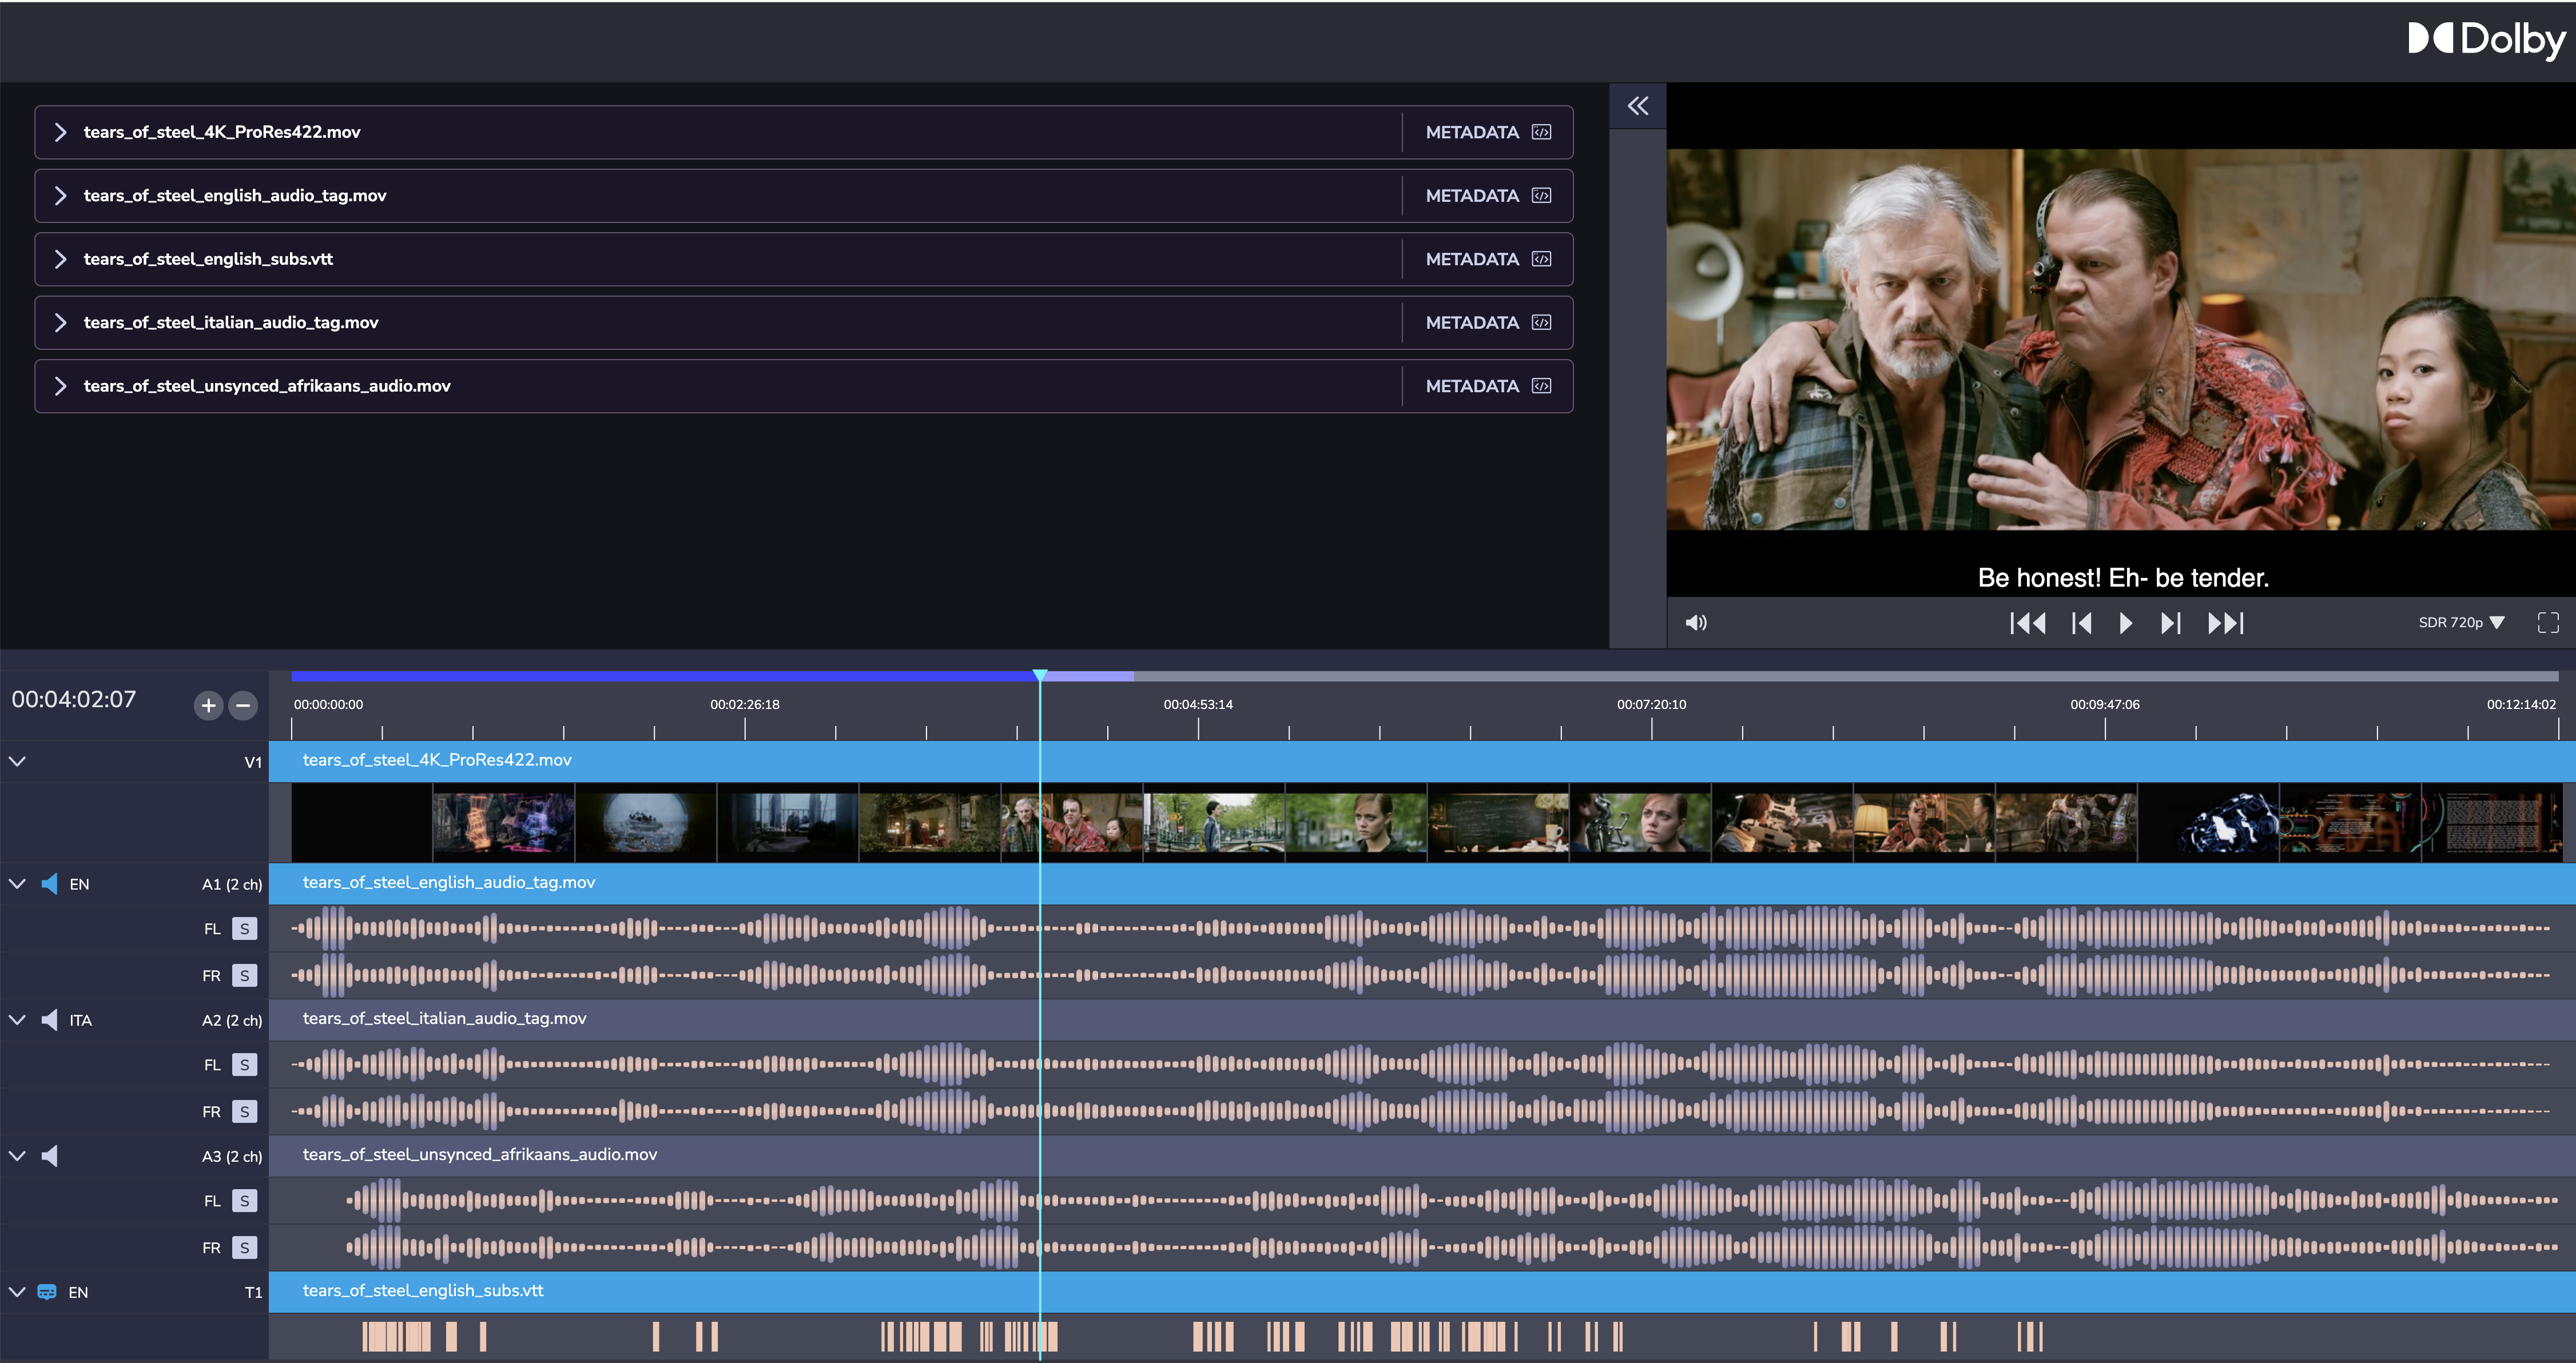
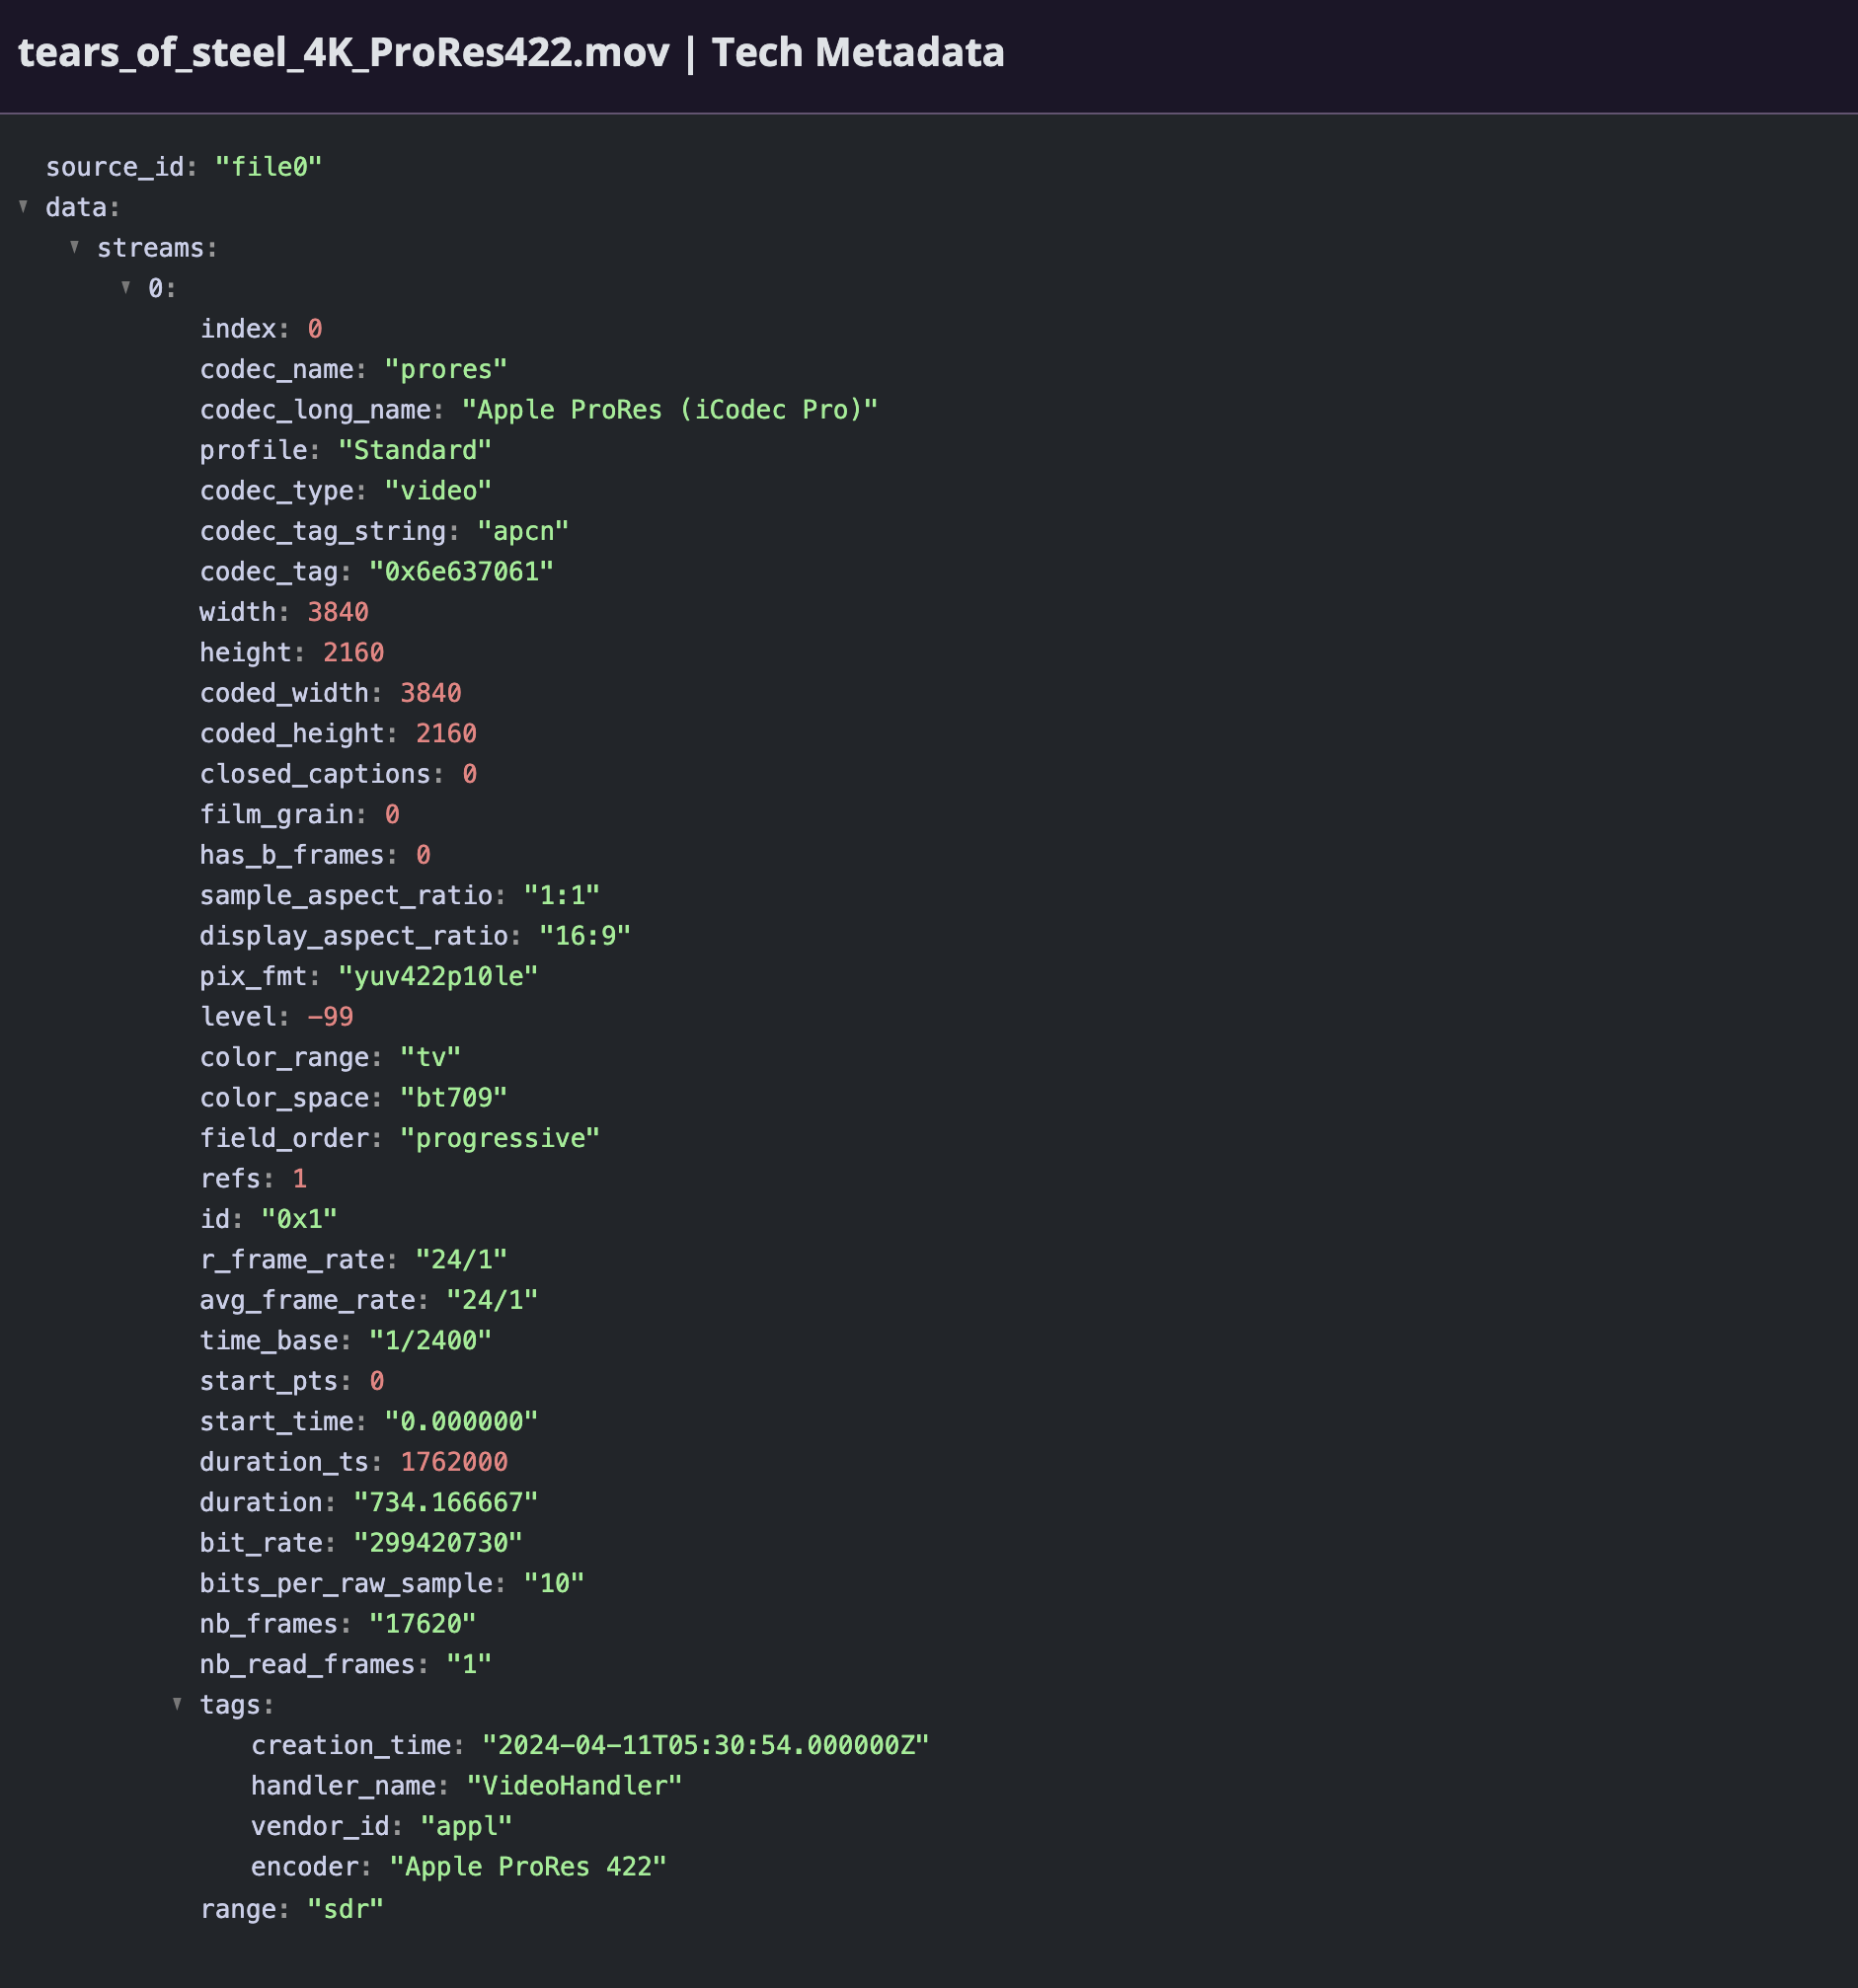
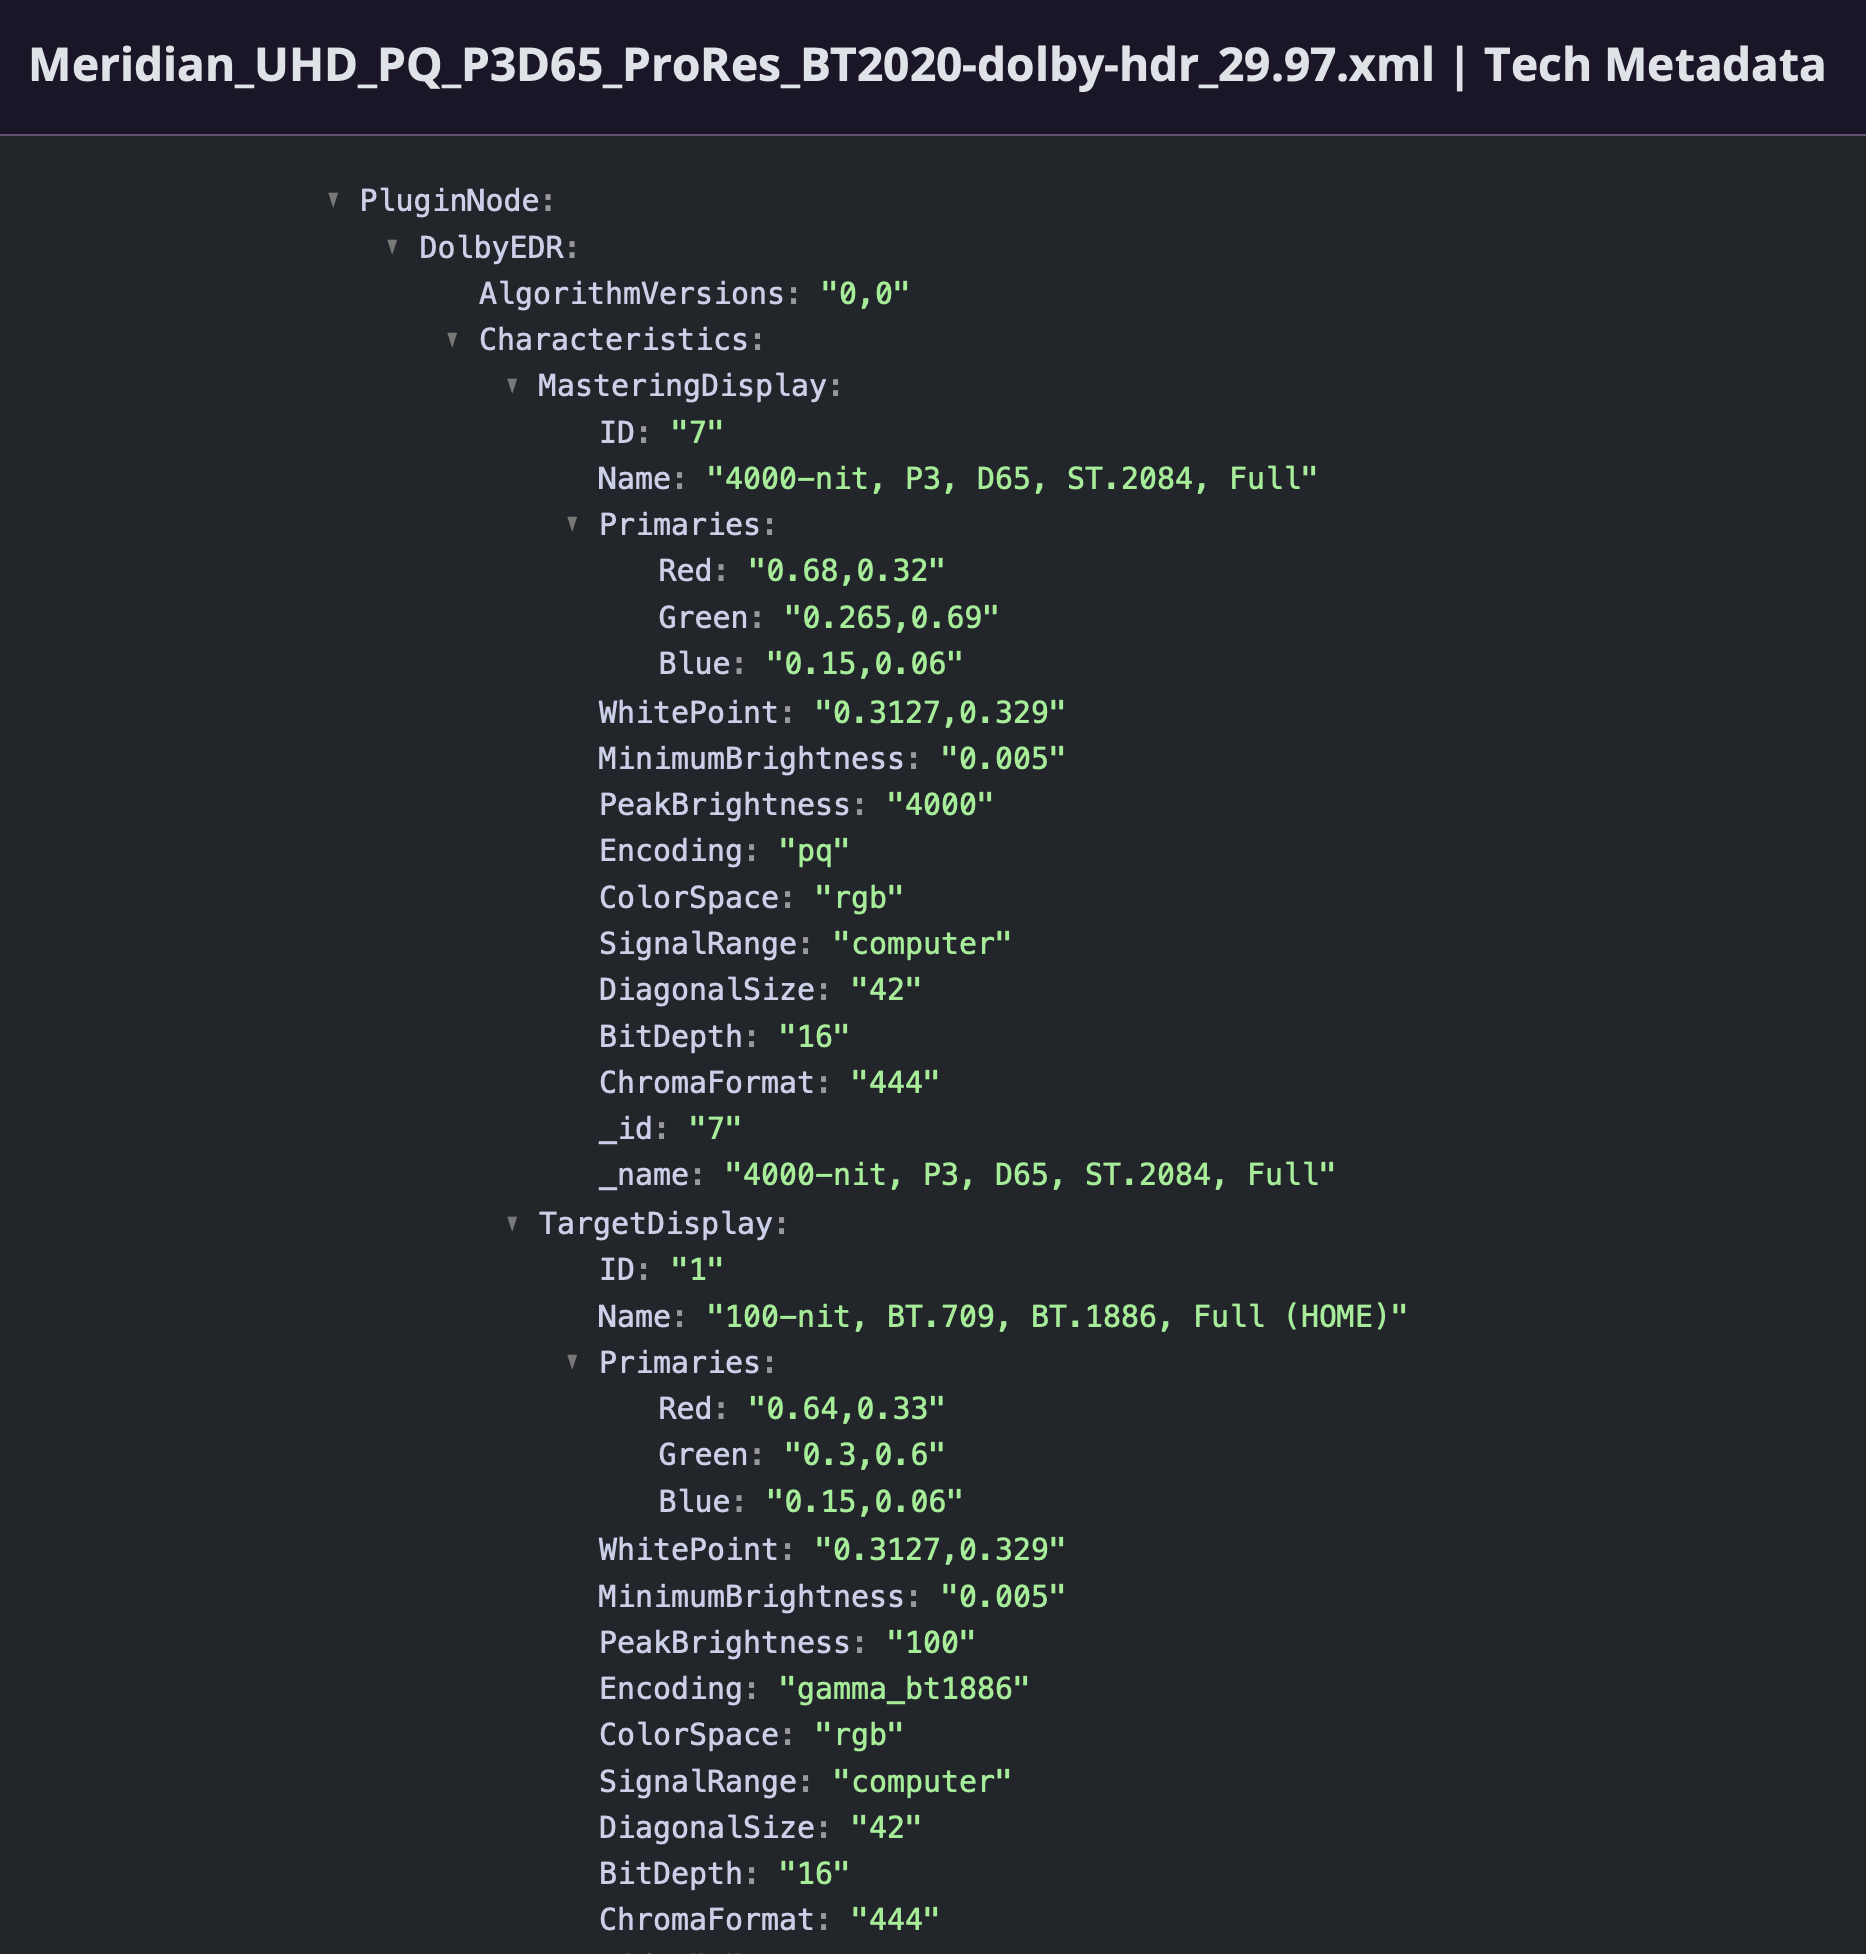
Metadata
The Cloud Player has three main sections: Metadata, Preview, and Timeline. In the Metadata section on the left, you can "twirl down" any file to see basic metadata about the file. This basic metadata includes things like number of video and audio tracks, bitrate, and codec.
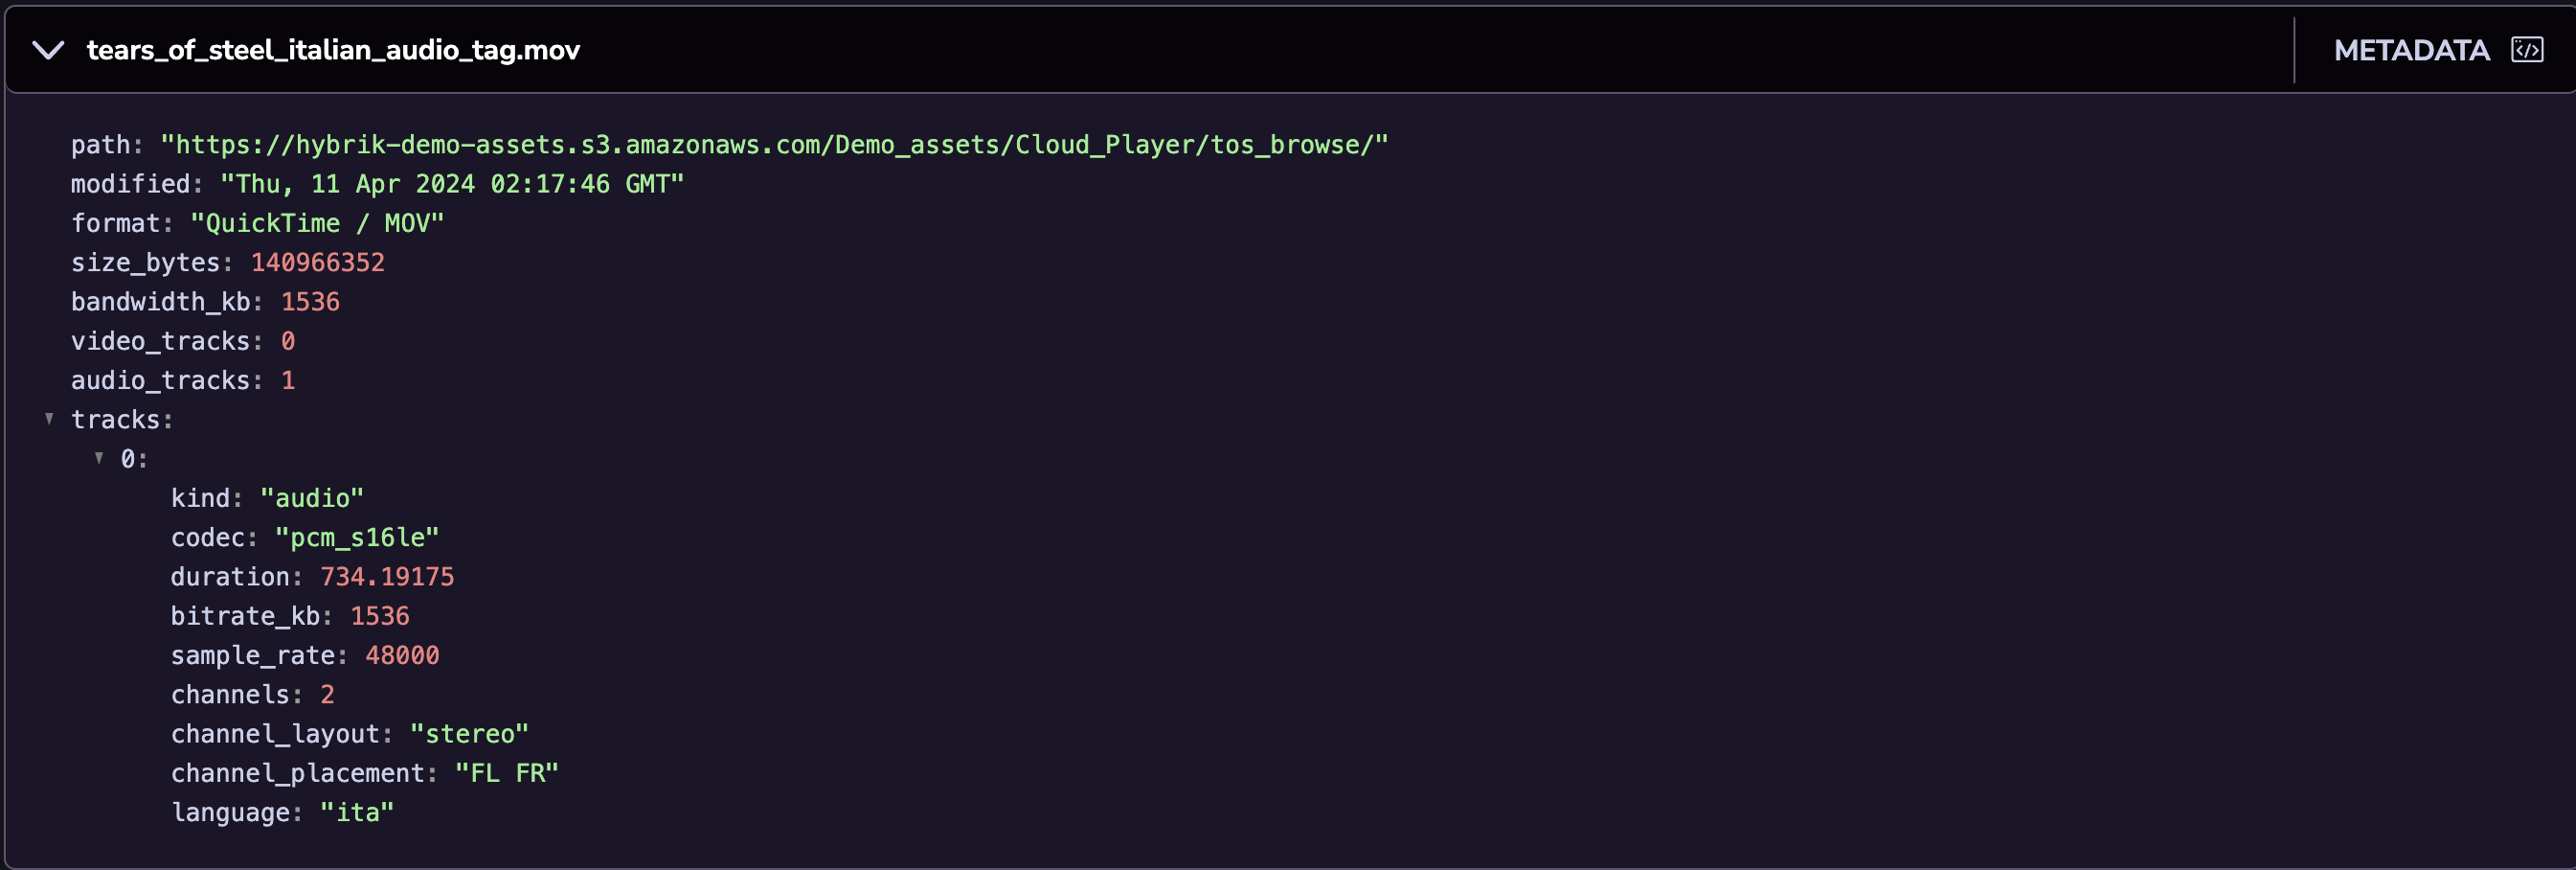
You can also click the "Metadata" button to the right of any file to get more detailed metadata information. This can be useful when you need to look at details like the color space or pts offset of a file. An example of what the technical metadata looks like is below:
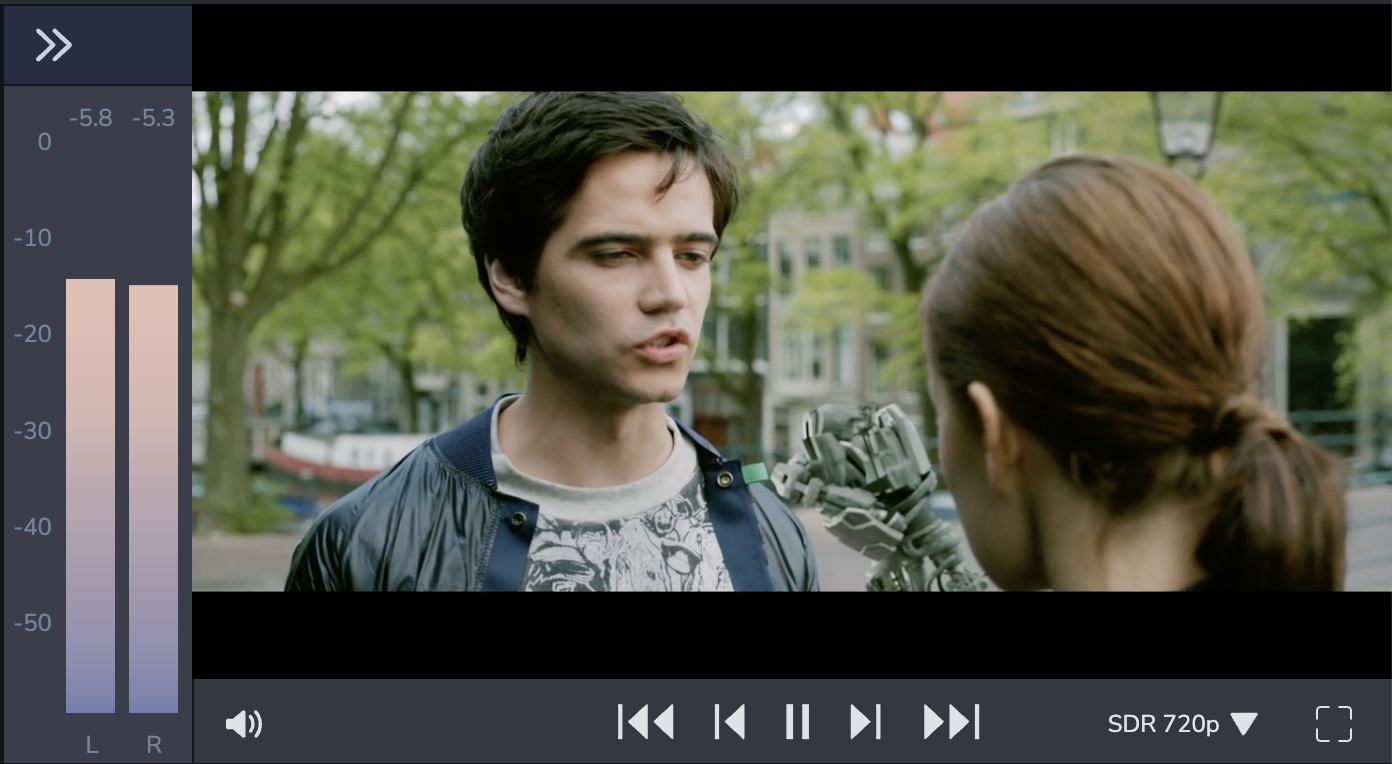
Playback
On the right side of the Cloud Player is the Preview section. The Preview gives you the audio and video playback controls. You can play and pause the video, as well as step forwards or backwards through the video 1 (or 5) frames at a time to check specific frames. You can also control the audio volume or mute the playback entirely. You can also select to play back the content in full-screen mode.
Timeline
The timeline looks similar to a video editing timeline, although the Cloud Player does not let you edit. It only lets you decide where in the timeline you are playing back and which components you would like to see (or hear). You may click on a different location in the timeline to jump to that point, or you can click-and-drag the timeline to a specific location. It can take a few seconds for the system to resume playback when you jump to a new location.
Clicking on a particular audio tracks "speaker" icon will allow you to hear that track. Clicking on a subtitle track icon will toggle the visibility of that subtitle in the Player window. Timeline tracks can be collapsed or expanded to focus on a particular item.
The timeline shows you a waveform for each channel of each track. It can be helpful to see if different audio tracks are in alignmend. You can "solo" an individual channel of audio to listen to it separate from the track. This can be useful, for example, to determine which of your unlabeled channels is actually the center channel. Only one channel can be soloed at a time.
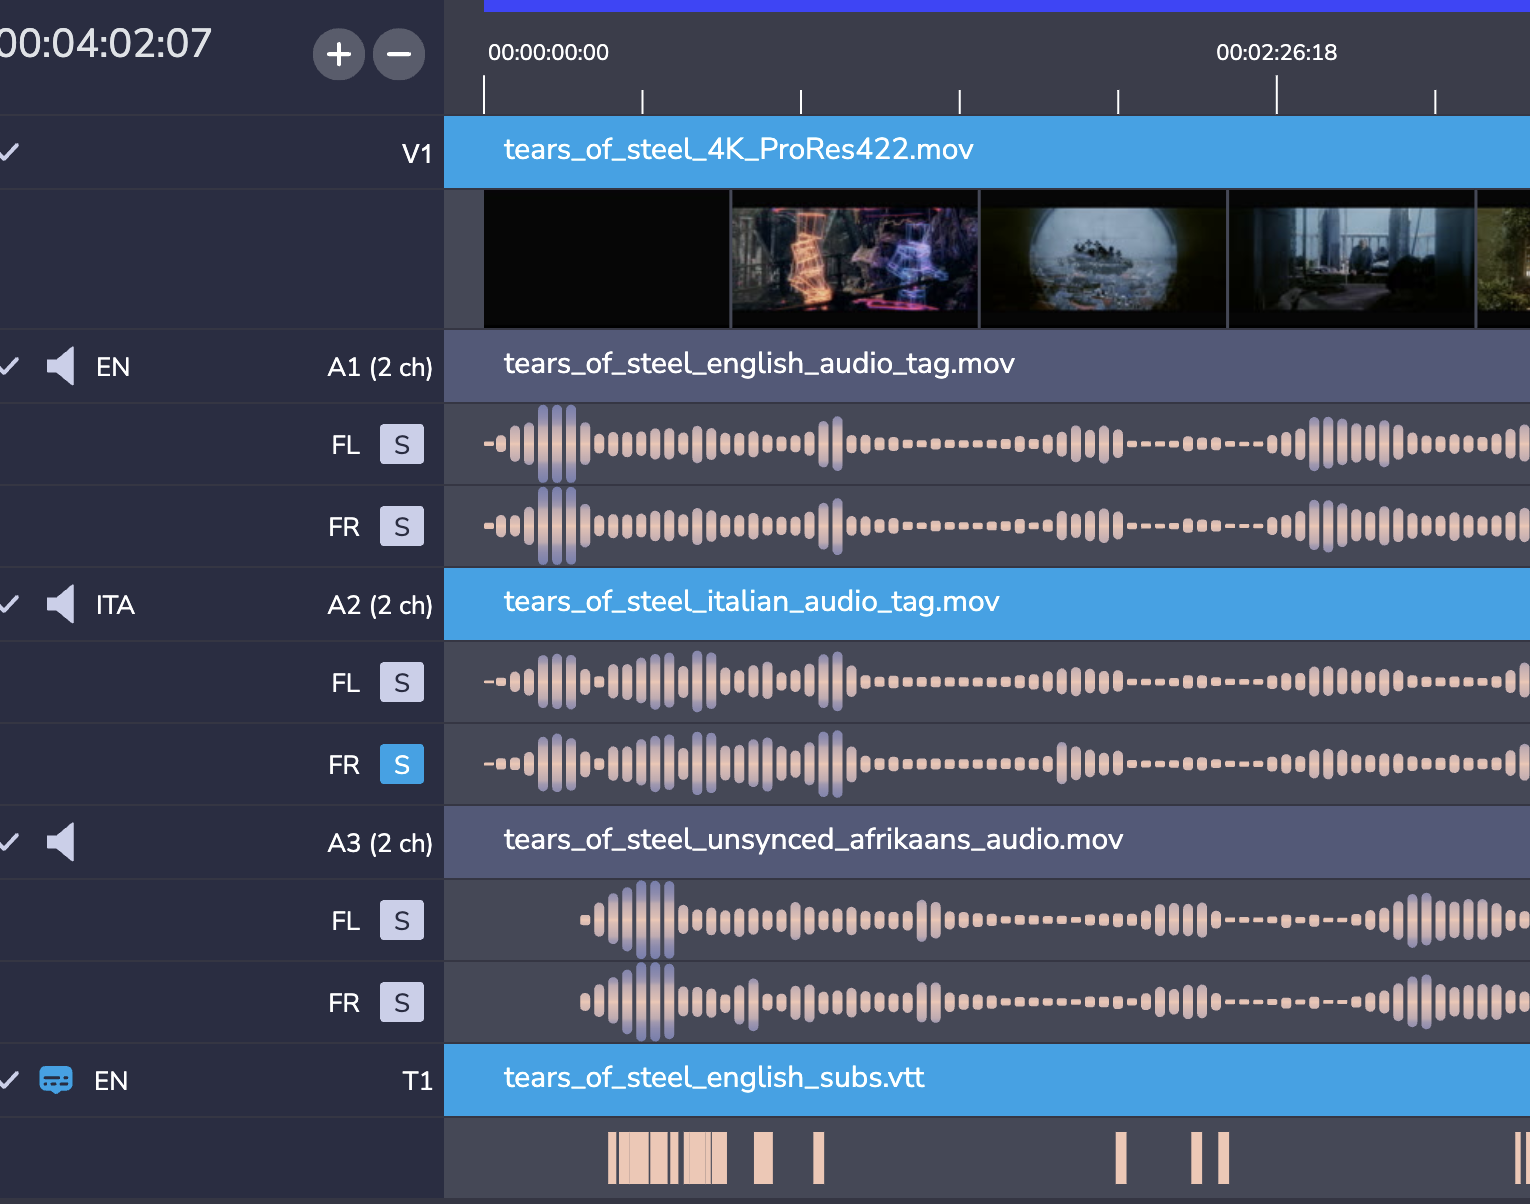
The timeline will also show you where subtitles have content. This is useful to be able to quickly scan to see if there are large sections missing subtitle content.
Dolby Vision Playback
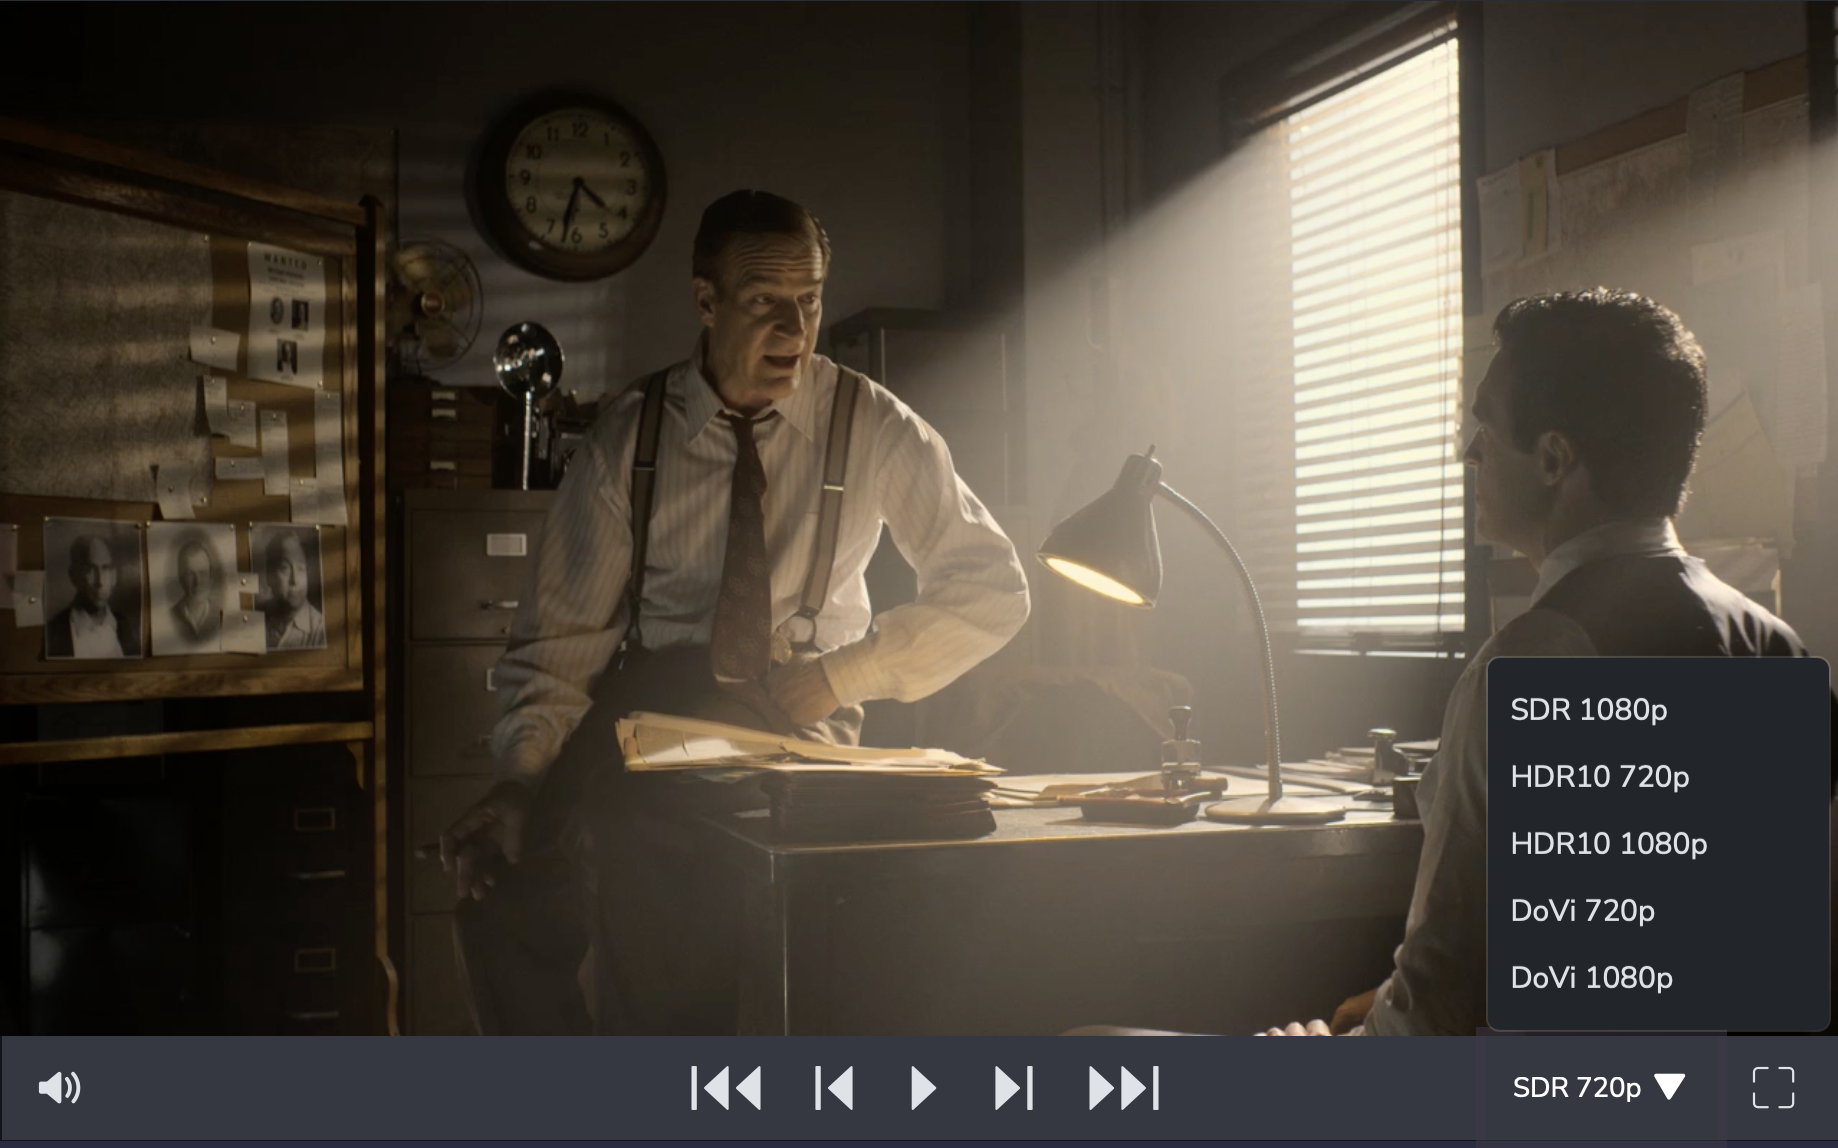
The Cloud Player is particularly useful for previewing Dolby Vision master files. These files can be difficult to test, since they are typically very high bitrate and are in color spaces that may not be supported on your monitor. Additionally, when a Dolby Vision file is delivered to the end viewer, it may be rendered in SDR or HDR depending upon the viewer's device capability. So, seeing how Dolby Vision would derive an SDR version from the HDR master can be very useful. In the Preview window, there is a dropdown menu that allows you to choose the color space and format of the playback. Note that the formats shown will depend on the capbilities of your browser. For example, the Dolby Vision playback option is available on Safari, whereas it is not available in Chrome.
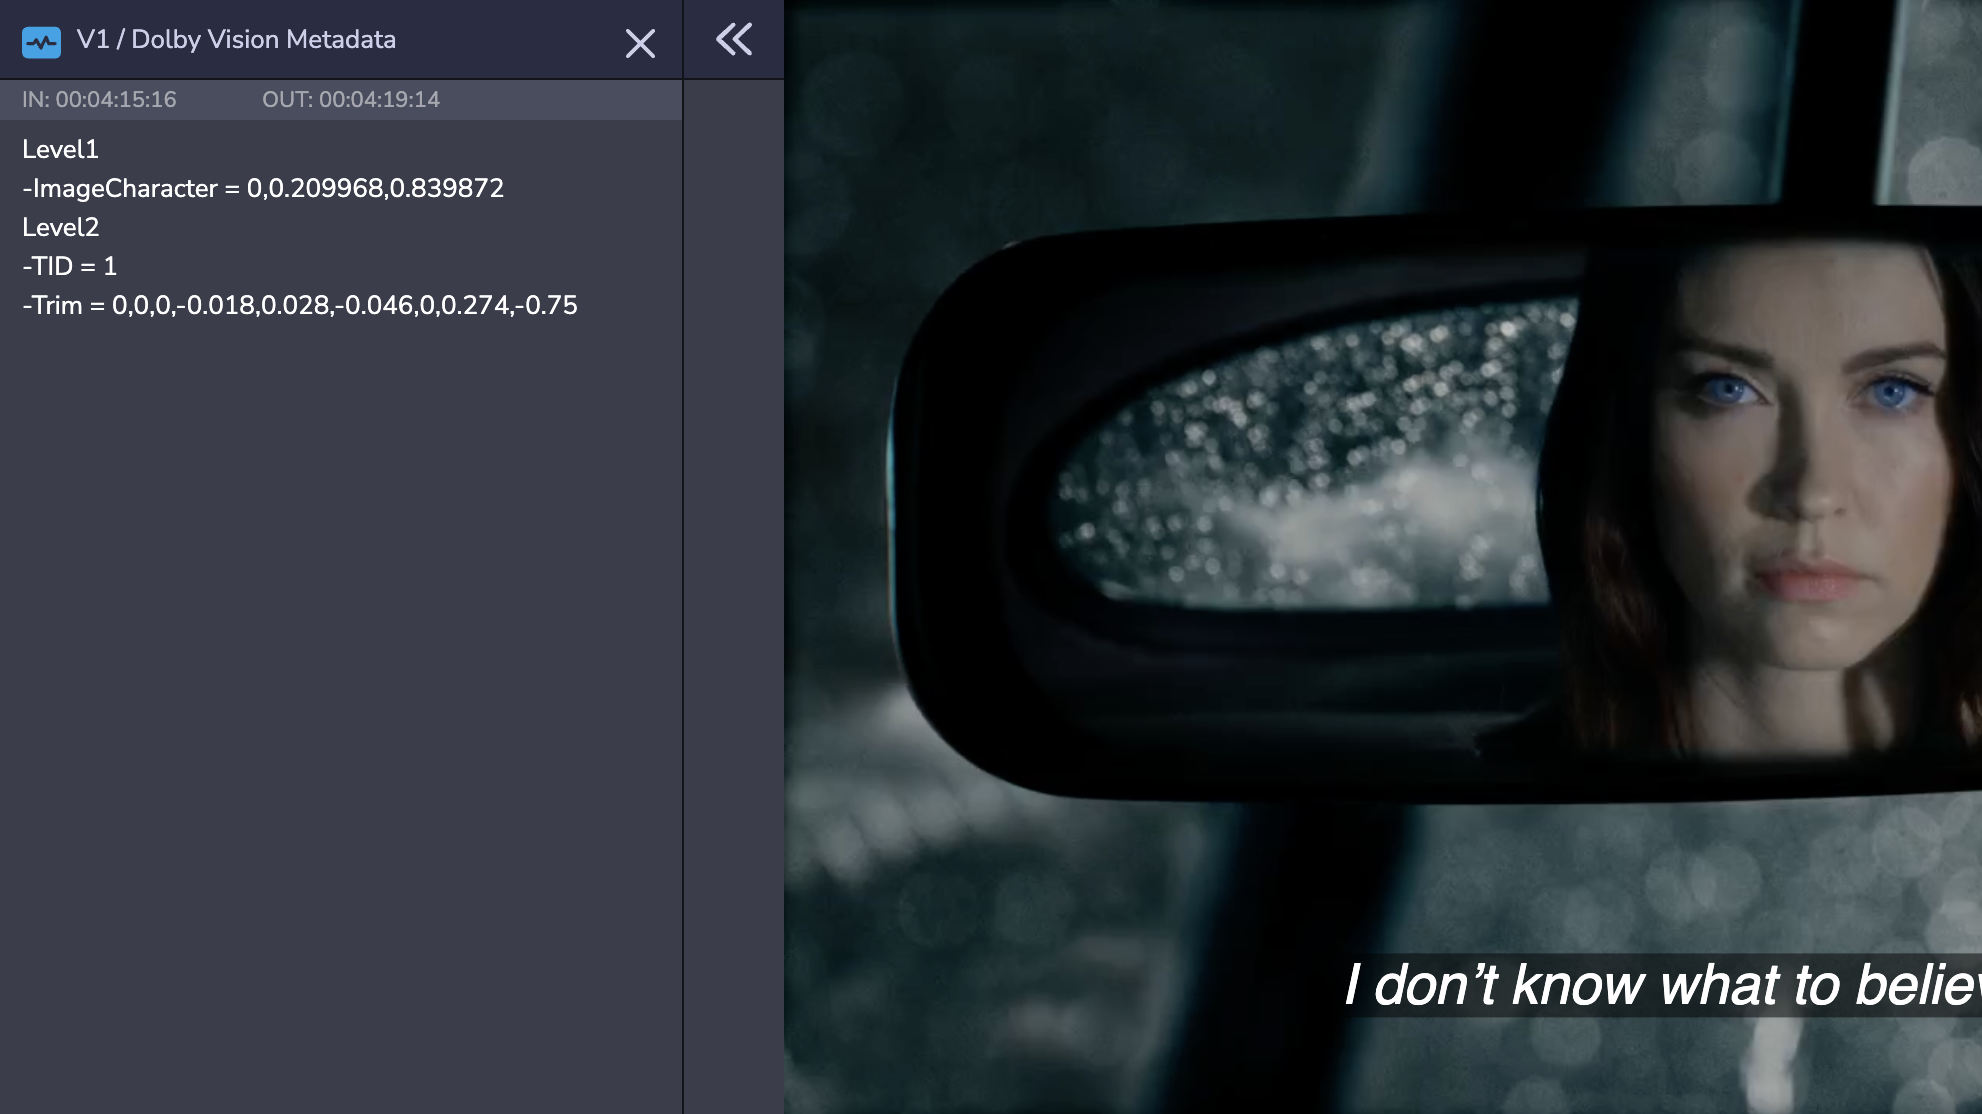
Dolby Vision Metadata
Another useful capability of the Cloud Player is to show your Dolby Vision Metadata. This can done in the Metadata window as seen below:
You can also see Dolby Vision metadata time-aligned with your video content. The "Telementry" section at the top can be expanded to show the Dolby Vision metadata for each frame. This is very helpful when debugging whether your metadata is correctly aligned with your shot boundaries.
Analyzer Results
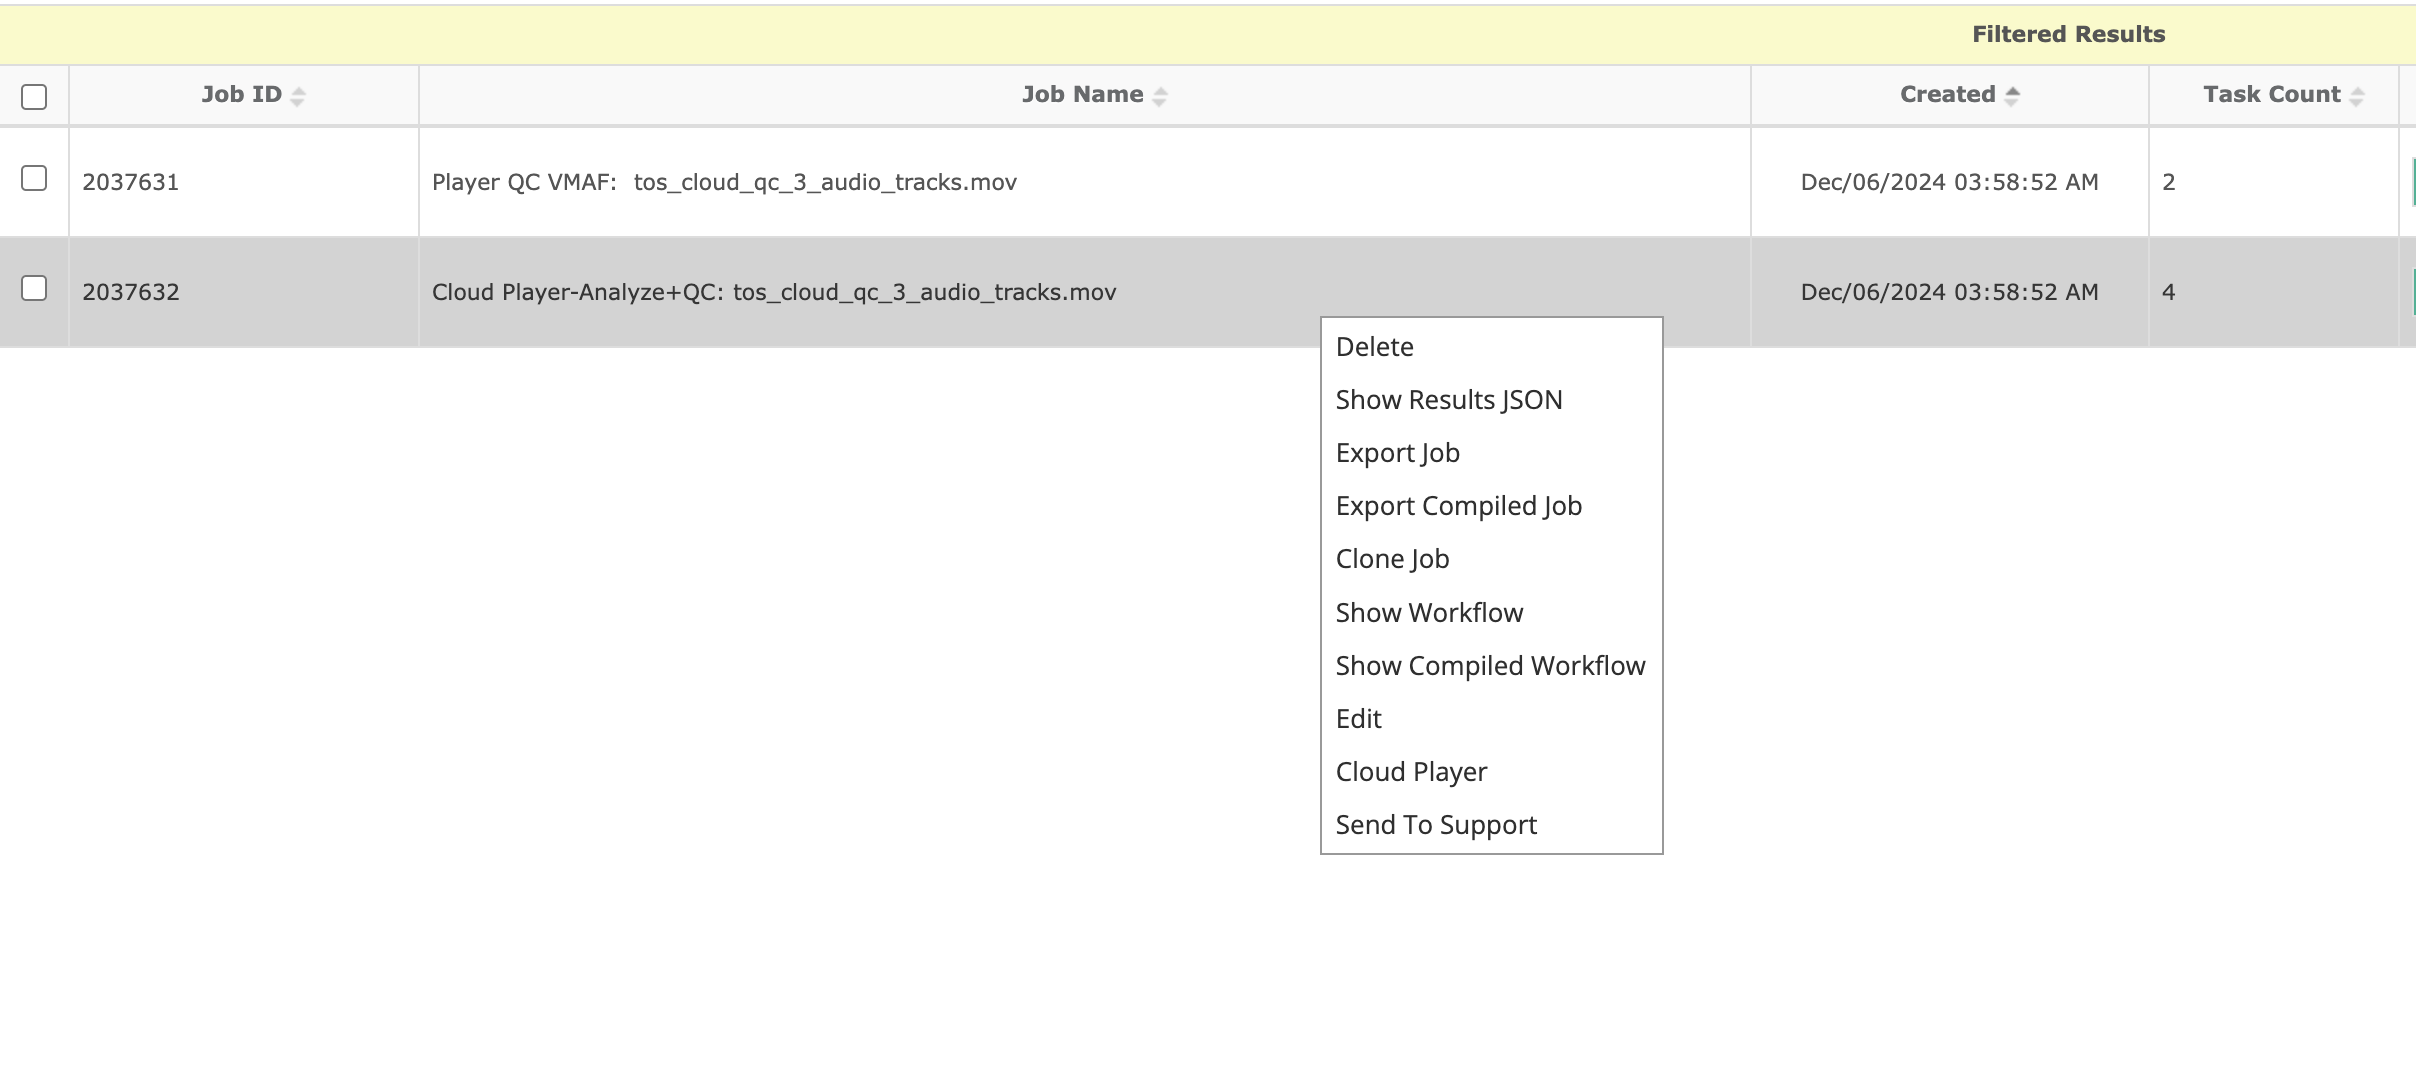
The Cloud Player can also show the results of Hybrik analysis and QC jobs in the same timeline with the audio visual components. In order to do so, you can select a completed QC job and right click on it and choose "Cloud Player" from the options.
The information from the Analysis Tasks will be shown in the timeline. The type of display will depend on the type of analysis. An analyzer that returns a series of time-based values (e.g. loudness) will be displayed as a line chart. An analyzer like silence, will show ranges where the anaylzer has detected an event.
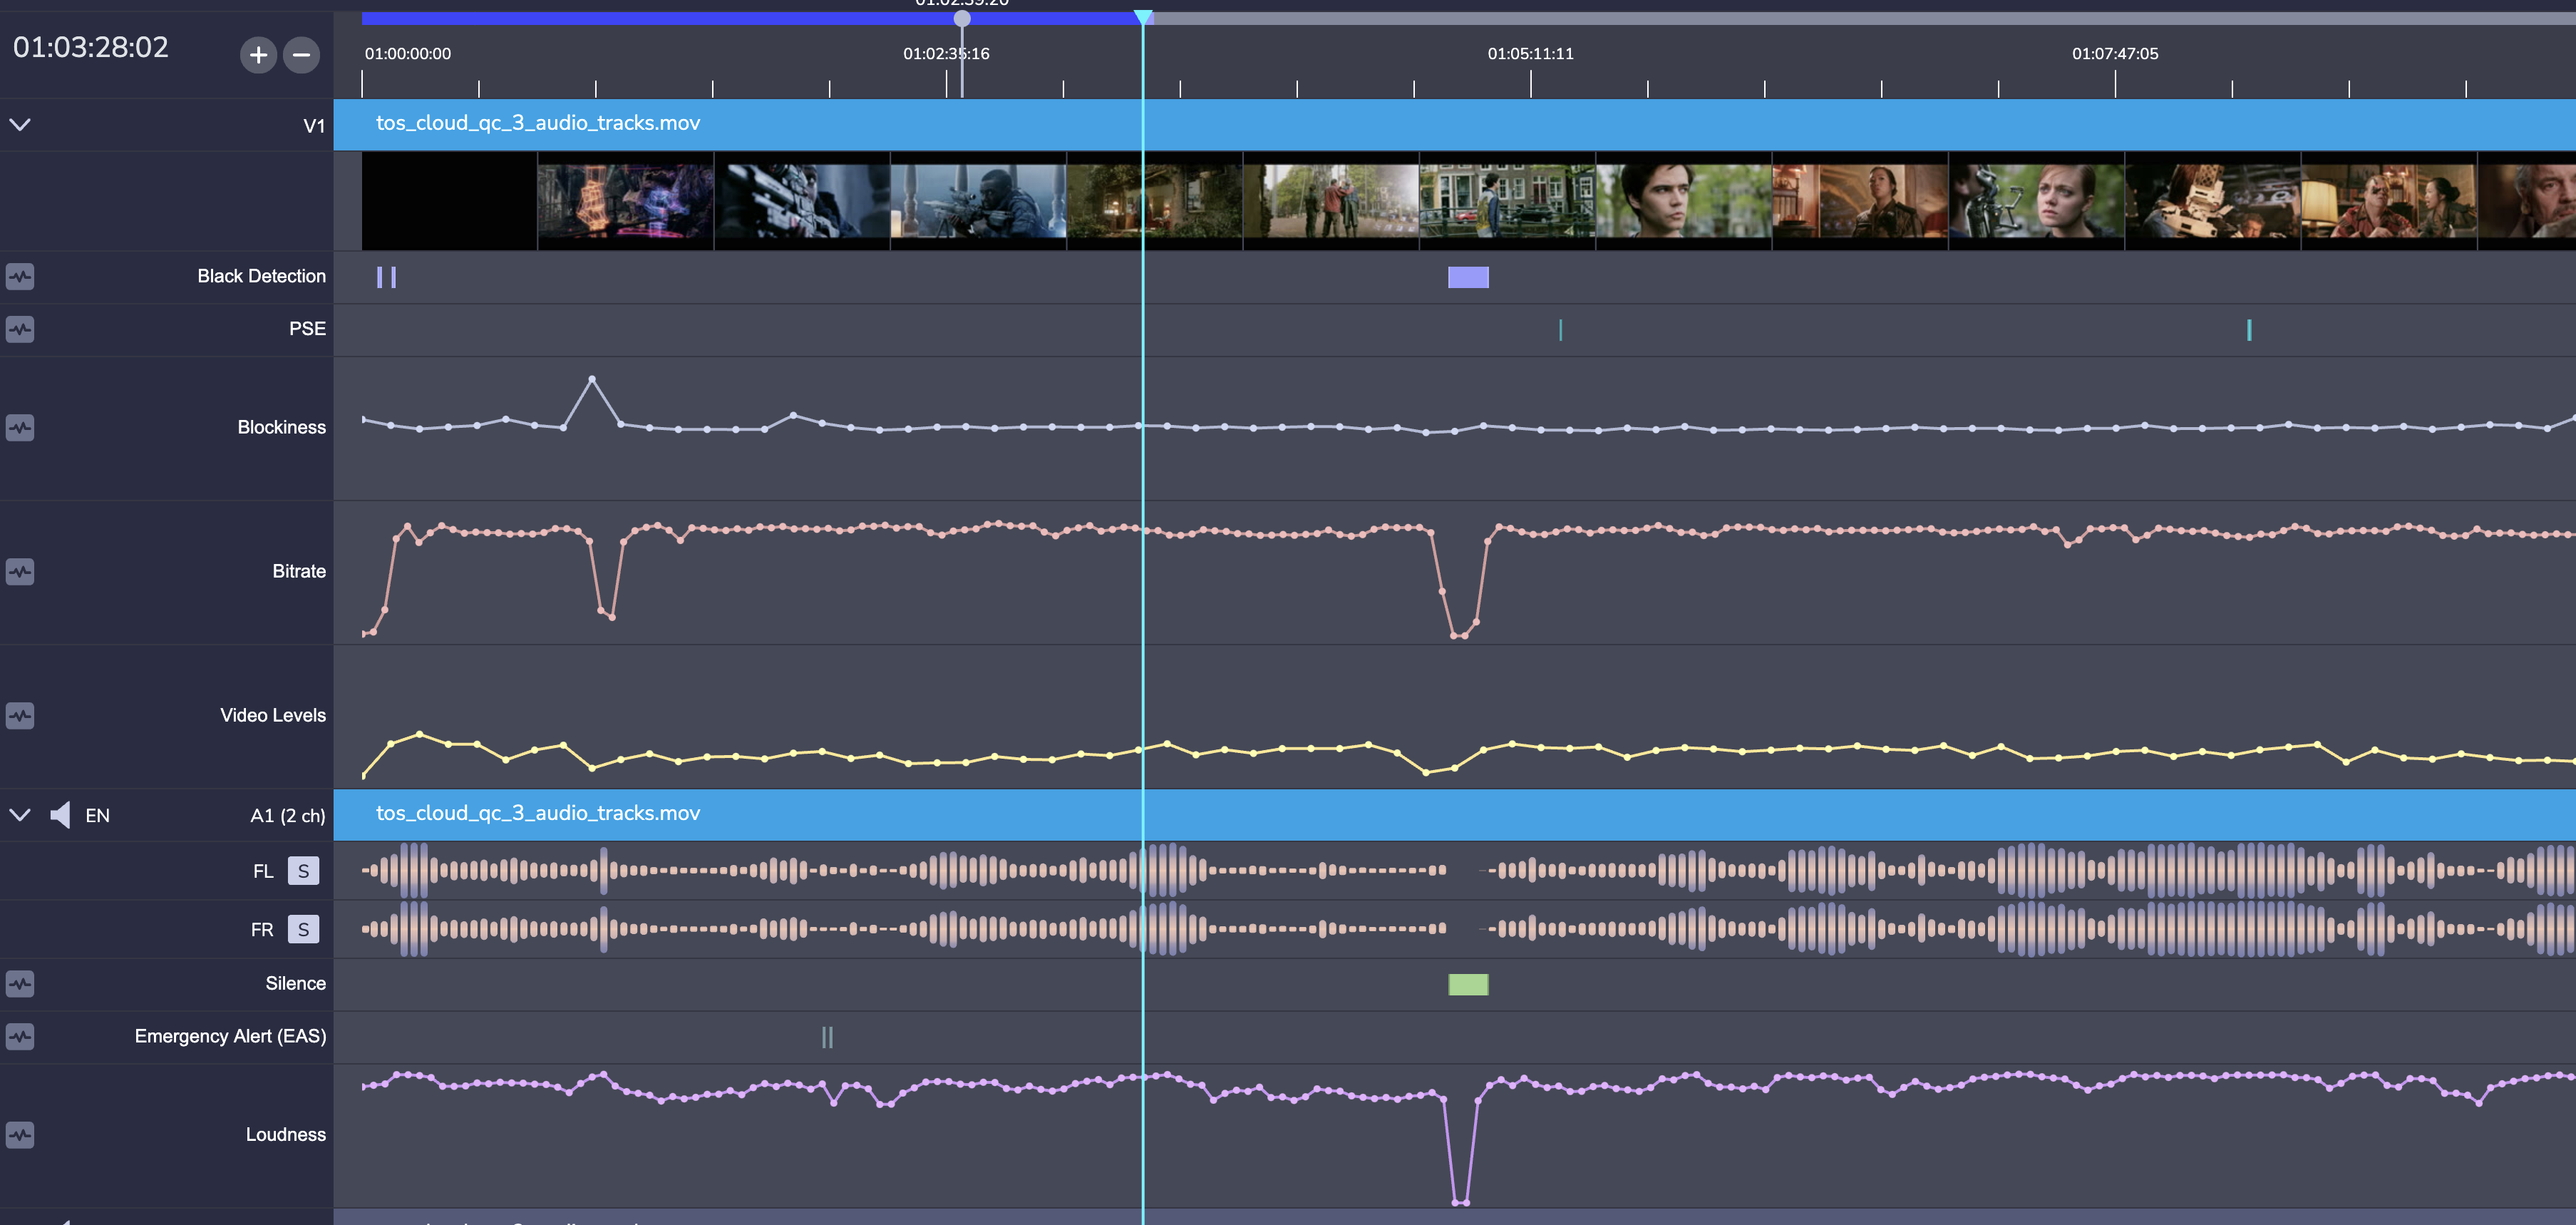
Selecting the waveform icon to the left of a particular analyzer will cause its values to be shown in the Telemetry window at the top. This can be useful to get, for example, the exact value of particular analyzer at a moment in time.
Keyboard Shortcuts
- Play/Pause:
spacebar - Previous Frame:
Left Arrow - Next Frame:
Right Arrow - Jump 1 Second Forward:
shiftUp Arrow - Jump 1 Second Backward:
shiftDown Arrow - Zoom In Timeline:
+ - Zoom Out Timeline:
- - Full-screen Playback:
F